EIS fit
Fit a negative-electrode exchange-current density from electrochemical
impedance spectroscopy (EIS) data with
EIS and DataFit.
import ionworks as iw
import matplotlib.pyplot as plt
import pandas as pd
import pybamm

# Synthetic example spectrum: Frequency [Hz], Z_Re [Ohm], Z_Im [Ohm]. Swap
# in your own export, or read a measurement with `client.cell_measurement`.
data = pd.read_csv(iw.pipeline.example_data("eis_synthetic"))

# The Arrhenius form below needs an activation energy, which Chen2020
# does not define; zero gives j0 no temperature dependence.
baseline = pybamm.ParameterValues("Chen2020")
baseline["Negative electrode reaction activation energy [J.mol-1]"] = 0.0
known = iw.pipeline.direct_entries.DirectEntry(parameters=baseline)

# j0 = j0_ref (c_e/c_e0)^0.5 (c_s/c_smax)^0.5 (1 - c_s/c_smax)^0.5
#      exp(E_r/R (1/T_ref - 1/T)), replacing Chen2020's own j0 function.
j0_function = (
    iw.pipeline.direct_entries.arrhenius_butler_volmer_exchange_current_density(
        electrode="negative"
    )
)

# We fit j0_ref.
parameters = {
    "Negative electrode reference exchange-current density [A.m-2]": iw.pipeline.Parameter(
        "Negative electrode reference exchange-current density [A.m-2]",
        initial_value=1.0,
        bounds=(0.1, 10.0),
    ),
}

objectives = {
    "impedance": iw.pipeline.objectives.EIS(
        data=data,
        options=iw.pipeline.objectives.EISOptions(
            model=pybamm.lithium_ion.DFN(options={"surface form": "differential"})
        ),
    )
}
fit = iw.pipeline.DataFit(
    objectives=objectives,
    parameters=parameters,
    cost=iw.pipeline.costs.RMSE(),
    # Capped to keep the example quick; a harder fit needs more.
    optimizer=iw.pipeline.optimizers.ScipyMinimize(
        method="Nelder-Mead", max_iterations=20
    ),
)

client = iw.api.Client()
submission = client.pipeline.create(
    iw.pipeline.Pipeline({"known": known, "j0_function": j0_function, "eis": fit})
)
client.pipeline.wait_for_completion(submission.id)
result = client.pipeline.result(submission.id)
fit_result = result.element("eis")
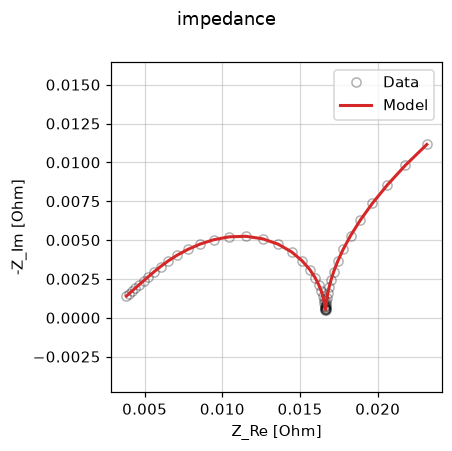
figs = fit_result.plot_fit_results()
plt.show()